





Economic Indicators
Learn which economic indicators move forex markets, why the surprise matters more than the number, and how NFP, CPI, and PMI connect to central bank decisions.
Authorship
Written by

Forex Market Analyst , an ICT Chartered Graduate with 18 years of live trading experience in forex, gold, and crypto.
Reviewed by

Forex market analyst and educator with a strong focus on technical analysis and trader psychology.
Key Takeaways
-
Economic indicators are scheduled data releases that measure different aspects of economic health. They move currency markets because they change expectations about central bank policy, and policy drives rate differentials.
-
What matters is not the absolute number but the surprise: how the actual reading compares to the consensus forecast. A strong number in line with expectations often produces little reaction. A strong number that significantly exceeds expectations produces a sharp one.
-
Indicators fall into three categories: leading indicators point toward future conditions, coincident indicators reflect the current state of the economy, and lagging indicators confirm trends that are already underway.
What Are Economic Indicators?
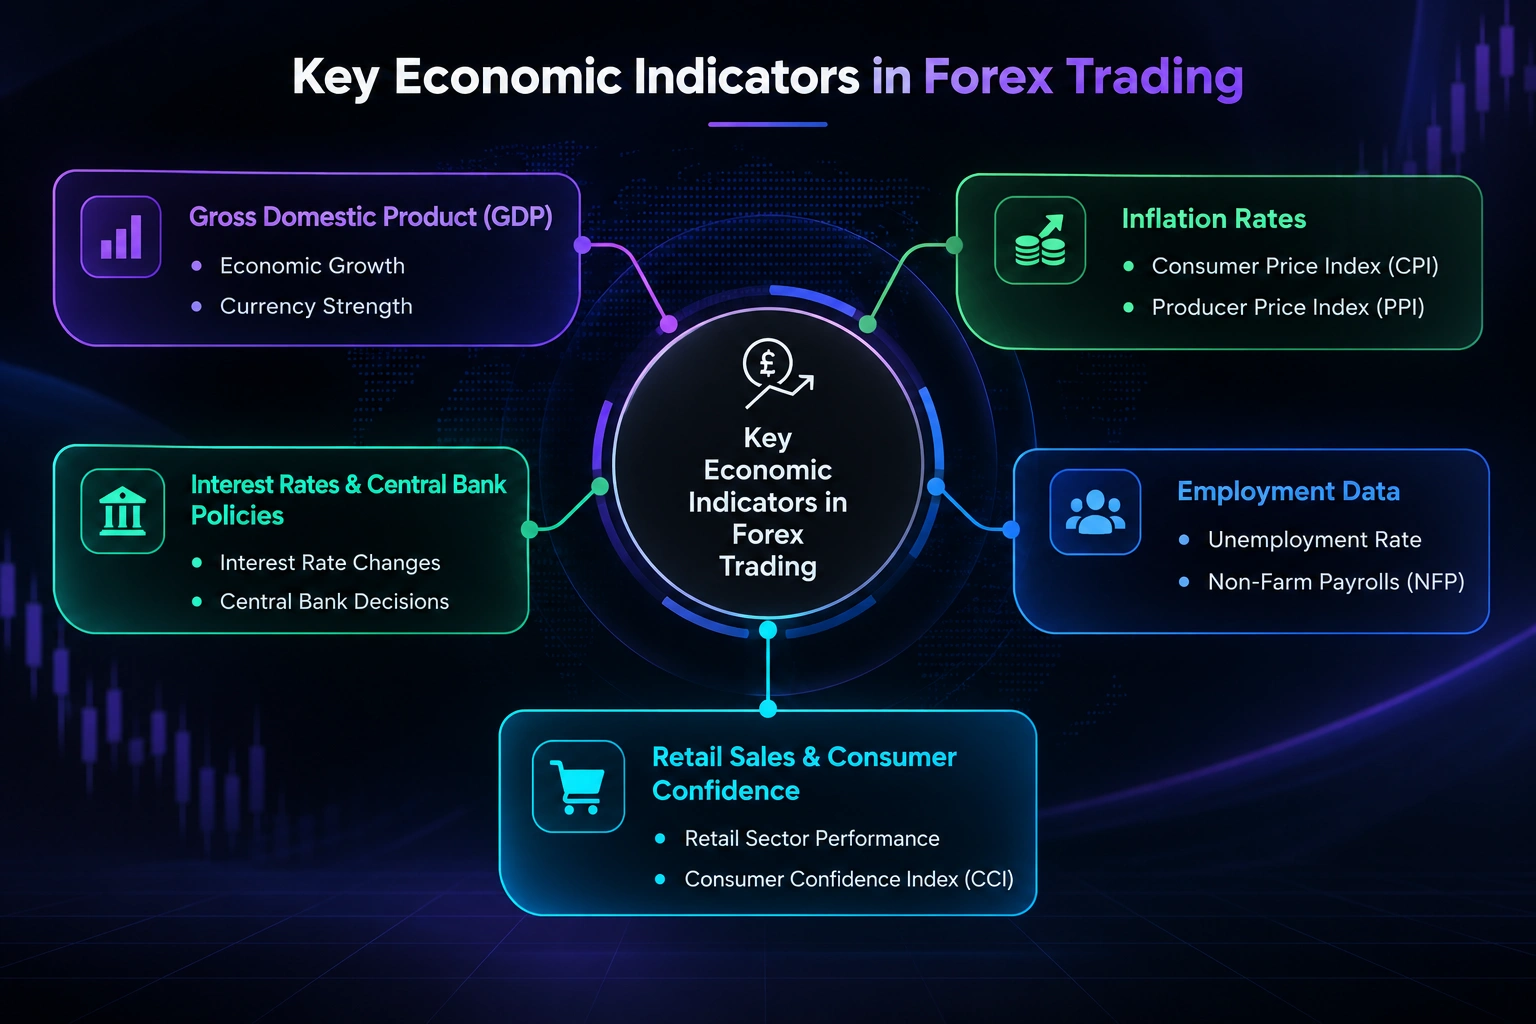
Every central bank decision is built from data. Before a rate committee votes on whether to hold, raise, or cut, its members have spent weeks reviewing employment figures, inflation readings, growth estimates, consumer spending data, and manufacturing surveys. The decisions they reach from that review are what drive currency markets over weeks and months. Economic indicators are the raw material of those decisions.
If you are new to the forces that drive currency prices, start with What Moves the Market before continuing.
An economic indicator is a scheduled data release published by a government agency, central bank, or statistical body that measures a specific aspect of economic activity. These releases come out on a fixed calendar, with dates and times published well in advance. Before a release, analysts produce a consensus forecast: the average estimate of what the number will show. When the actual figure is published, the market reacts not to the number in isolation but to the gap between what was expected and what was delivered.
That gap is the engine behind most short-term volatility in forex markets.
How Does It Work?
The surprise factor
A single principle governs how economic data moves markets: the surprise is what matters. A strong jobs report that matches the forecast produces a muted reaction, because the market had already priced in that strength. A jobs report that comes in at double the forecast produces a sharp, immediate move, because the new information forces a rapid repricing of expectations.
Every indicator release involves three numbers: the previous reading, the consensus forecast, and the actual result. Reading all three together tells you more than the headline figure alone. A result that beats the forecast but comes in below the previous month paints a different picture from one that beats both. Revisions to prior data add a further layer that markets frequently react to as strongly as the new figure itself.
One implication of this is worth stating directly: a strong report can still trigger a decline if traders expected an even stronger result. A weak report can trigger a rally if traders feared something much worse. The direction of the market reaction depends on the surprise relative to consensus, not on whether the number is objectively good or bad. This explains many market reactions that initially appear contradictory.
Leading, coincident, and lagging indicators
Indicators fall into three broad categories based on their relationship to the economic cycle.
Leading indicators change before the broader economy changes. They are forward-looking and give the earliest warning of where conditions are heading. PMI surveys are among the most closely watched. When the manufacturing or services PMI falls below 50, it signals contraction before the official data confirms it. Consumer confidence surveys and building permits fall into the same category.
Coincident indicators move broadly in line with the current state of the economy. Non-Farm Payrolls, retail sales, and industrial production all measure what is happening now rather than what is coming. These are the releases that most directly move forex markets in real time.
Lagging indicators confirm trends that are already established. Unemployment rates and CPI often fall into this category, not because they are unimportant, but because they reflect conditions from weeks or months earlier. The Fed still watches them closely, which means markets do too.
The key indicators
Non-Farm Payrolls is released on the first Friday of each month by the US Bureau of Labor Statistics. It measures the change in total employment outside the agricultural sector. It is the single most important monthly data release for forex traders because of its direct connection to Fed policy. Readings that significantly beat or miss consensus regularly move EUR/USD, GBP/USD, and USD/JPY by 50 to 100 pips or more within minutes.
CPI (Consumer Price Index) measures the rate of price change across a basket of consumer goods. It is the primary inflation gauge central banks use to justify rate decisions. A CPI print above expectations strengthens the case for a rate hike or a hold. A reading below expectations increases the probability of a cut.
PPI (Producer Price Index) measures inflation at the producer level, tracking changes in the prices businesses pay for goods and services. Because producer costs often feed through to consumer prices over the following weeks, many traders use PPI as an early warning signal for where CPI is heading. A rising PPI trend that has not yet appeared in CPI gives advance notice that consumer inflation may follow.
The unemployment rate measures the percentage of the labour force actively seeking work but unable to find it. Low unemployment reflects a tight labour market where workers are scarce, wages are rising, and consumer spending is healthy. High unemployment signals slack in the economy and increased pressure on a central bank to cut rates. The unemployment rate is released alongside NFP each month and provides the broader context within which the jobs number is interpreted.
PMI surveys provide the earliest monthly read on economic conditions. Because they are surveys of purchasing managers rather than hard data, they publish quickly and give traders a real-time pulse of activity weeks before official output data confirms the picture. A reading above 50 indicates expansion. Below 50 indicates contraction.
Retail sales measure consumer spending, which accounts for a significant portion of GDP in most developed economies. Strong retail sales suggest consumer confidence and economic momentum. Weak readings raise questions about demand and growth.
Central bank decisions are the most market-moving calendar events in forex. Rate decisions are rarely a complete surprise because the preceding weeks of data give markets time to price in the probable outcome. What surprises markets is the accompanying statement and press conference: the guidance about future direction, the language around inflation risks, and the tone of the presiding official.
High, medium, and low impact releases
Not all indicators move markets equally. Understanding the tier each release belongs to tells you how much attention it deserves and how much volatility to expect.
High-impact releases include interest rate decisions, Non-Farm Payrolls, CPI, and GDP. These have the most direct connection to central bank policy and regularly produce significant, sustained moves in major pairs.
Medium-impact releases include retail sales, PMI surveys, and consumer confidence. These influence market sentiment and can reinforce or soften an existing directional move, but they rarely produce the same sharp reaction as tier-one releases.
Low-impact releases include housing data, regional surveys, and secondary economic figures. These have limited market impact in isolation and are generally only relevant when they form part of a broader pattern of data.
Revisions matter
Every data release includes revised figures for the prior period. These revisions can be as significant as the new number. A month that appeared weak when first reported may be revised sharply higher, changing the read on economic momentum entirely. A strong headline print accompanied by a large downward revision to the previous month tells a more cautious story than the headline alone suggests.
Example
The May 2026 Non-Farm Payrolls report, published on June 5, 2026, produced one of the clearest demonstrations of the surprise effect in recent market history. Here is how the release unfolded:
|
Indicator Component |
Detail |
|
Release date |
5 June 2026 |
|
Previous reading (April, revised) |
+179,000 (revised up from +115,000) |
|
Consensus forecast |
~85,000 |
|
Actual result |
+172,000 |
|
Surprise |
+87,000 above consensus (more than double the forecast) |
|
Unemployment rate |
4.3% (in line with expectations) |
|
Average hourly earnings |
+3.4% year-on-year (in line) |
The print was more than double the consensus forecast. Confirmation came simultaneously from the Bureau of Labor Statistics, CNBC, Forex.com, and FXStreet, all reporting the same headline figure. Markets reacted immediately. The dollar strengthened across the board, Treasury yields moved higher, and EUR/USD fell from approximately 1.1635 to 1.1550, a drop of 80 to 100 pips within the session. Forex.com noted that traders now fully priced in a Federal Reserve rate hike by year-end, a notable shift from where expectations sat just weeks earlier.
The revision component added a further layer. April's figure had initially been reported as 115,000. The June release revised it upward to 179,000. Combined with the March revision, the two-month cumulative upward revision totalled 93,000 additional jobs. The headline beat was significant. The revision story confirmed that the broader trend in the labour market was stronger than the prior reports had suggested.
Why It Matters
Economic indicators are the mechanism by which macro conditions translate into price movement. Technical analysis can tell you that EUR/USD is sitting at a key support level. It cannot tell you that a data release in three days is likely to shift the rate differential narrative and push that support through. Knowing which indicators are due, what the consensus expects, and what a surprise in either direction would mean for central bank policy gives you context that no chart can provide.
The sequence from the previous article applies here directly. Data surprises shift central bank expectations. Shifted expectations change the rate differential outlook. A changed differential attracts or repels capital flows. Capital flows move the price. The moment the NFP figure printed at 172,000 against an 85,000 forecast, every trader who understood that sequence knew which direction the dollar was going and why.
Indicators also affect how you manage existing positions around release dates. A long position in EUR/USD held into a strong US jobs report faces a specific, identifiable risk. Knowing it is coming, knowing what the consensus expects, and knowing how large a surprise might move the pair gives you the information needed to decide whether to reduce size, tighten the stop, or hold with eyes open. For a deeper look at how to size positions and manage stops around high-impact data releases, read Risk Management alongside this topic.
Common Mistakes
| No | Mistake |
Why It Matters |
| Mistakes 1 | Reacting to the headline without reading the full report | The headline NFP number is one part of a broader release that includes the unemployment rate, wage growth, and prior month revisions. A strong headline combined with a large downward revision and slowing wage growth tells a different story from the same headline with upward revisions and accelerating earnings. Reading the full picture prevents misreading the market's subsequent reaction. |
| Mistakes 2 | Not knowing what is already priced in | If the consensus forecast is already for a strong number, the market has partially positioned for it. A strong reading that merely meets expectations may produce little movement or even a reversal. The surprise relative to consensus is the driver, not the number in isolation. |
| Mistakes 3 | Treating all releases equally | NFP, CPI, and central bank decisions move markets because of their direct connection to rate policy. Most other releases have a much smaller and shorter-lived impact. Allocating the same attention and risk to every calendar event produces a distorted picture of what actually drives the pairs you are trading. |
Quick Summary
| 1 | Economic indicators are scheduled releases that measure economic health. They move markets by changing expectations about central bank policy. The surprise relative to consensus forecast produces the reaction, not the absolute number. A strong result can trigger a decline if expectations were even higher. |
| 2 | Leading indicators (PMI, consumer confidence) point toward future conditions. Coincident indicators (NFP, retail sales) measure current activity. Lagging indicators (CPI, unemployment) confirm established trends. High-impact releases (interest rate decisions, NFP, CPI, GDP) produce the largest and most sustained moves. |
| 3 | Revisions to prior data are as important as the new headline figure. Reading all three components, previous, forecast, and actual, gives a fuller picture than the headline alone and often explains market reactions that the new number alone would not justify. |
Next Steps
You can now read scheduled economic data and understand how it connects to central bank expectations and currency direction. The next step is a deeper look at the most comprehensive single measure of economic health.
GDP - Learn how Gross Domestic Product measures the total output of an economy, why quarterly GDP releases move markets, and how growth trajectories shape the longer-term direction of a currency.
What Moves the Market - Revisit the broader forces that drive price and see how economic indicators fit into the full picture of fundamental analysis.
Take Action
Open a free economic calendar and find the next scheduled Non-Farm Payrolls release date. Note the previous reading and the current consensus forecast. In the days before the release, check whether any Fed officials are speaking and what they are saying about the labour market. On release day, compare the actual figure against the forecast and watch how EUR/USD and DXY react in the first 30 minutes. Then check back an hour later to see whether the initial reaction held or reversed. Practice reading indicator releases alongside the economic calendar on a demo account before making any trading decisions around live data.


